![]() LS I +61 303 Simulations
LS I +61 303 Simulations
1. Introduction
This page has links to movies from a simulation for the colliding wind model of LS I +61 303. I've run this simulation for comparing with the accretion model. The movies show that the interaction surface between the colliding winds doesn't agree with the VLBA maps of this system, and therefore suggests that the colliding wind model doesn't work for LS I +61 303. For more detailed discussion on both models, see Romero, Okazaki, Orellana & Owocki (2007, A&A, 474, 15 or astro-ph/0712.1832).
| Accretion model | Colliding wind model |
|---|---|
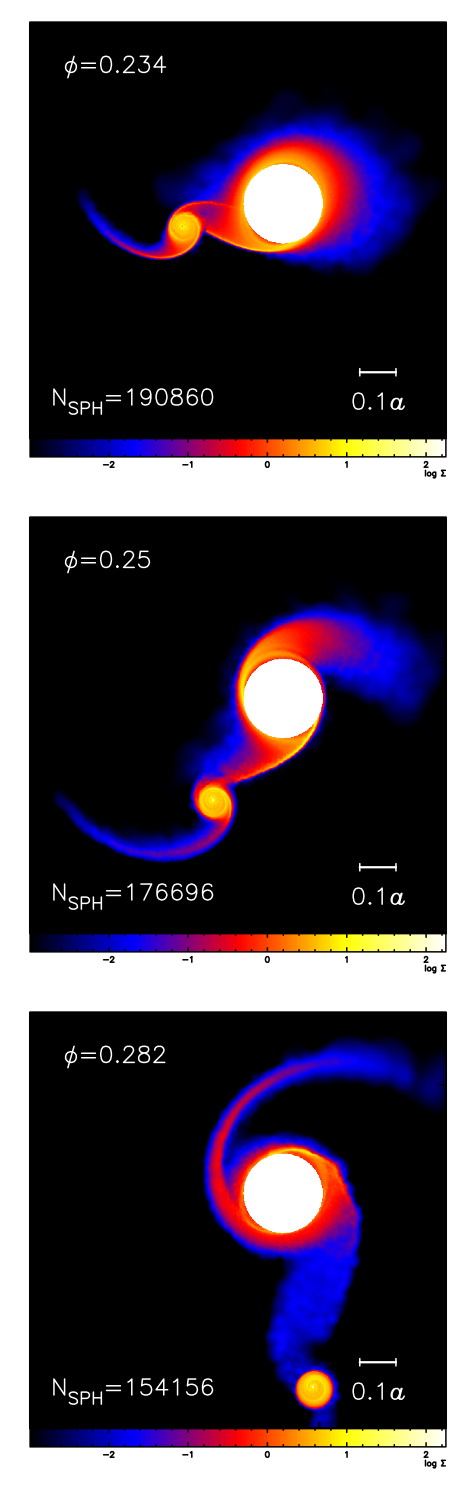
Mosaic snapshots from a Be disc simulation and the corresponding |
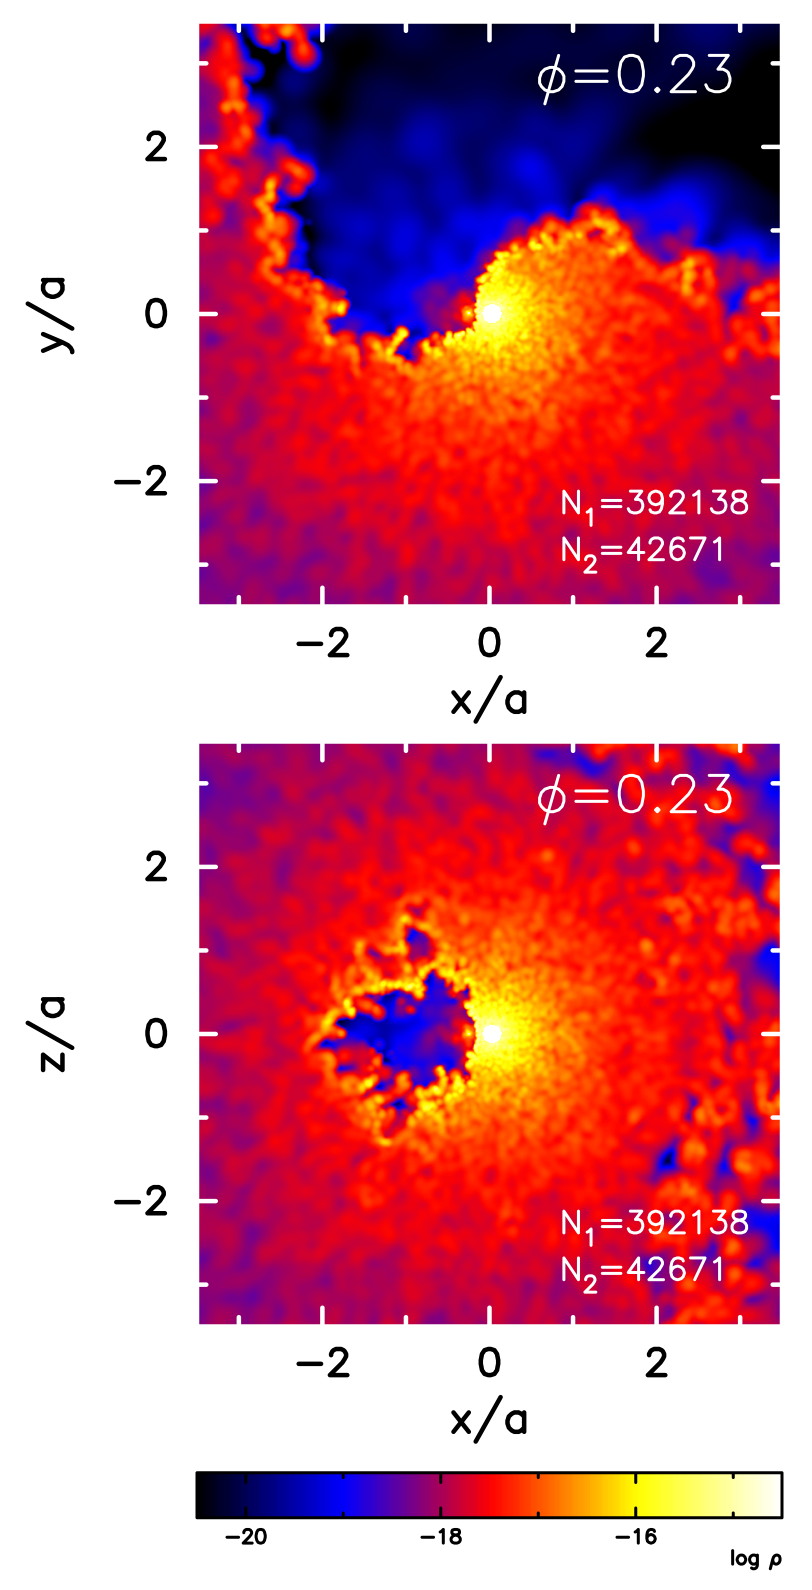
Wind collision interface geometry at periastron for collision between a Be-star wind with a pulsar wind of energy 1036 erg/s, corresponding to pulsar/Be wind momentum ratio of eta = 0.53. The upper panel shows the density in the orbital plane and the lower panel the density in the plane perpendicular to the orbital plane and through the major axis of the orbit, on a logarithmic scale with cgs units. The bright spot near the origin represents the Be star, while the small bright spot to the left represents the pulsar. |
2. Movies
In the following simulation, the binary orbit is on the x-y plane and the major axis of the orbit is along the x-axis (+x-axis is in the direction of the apastron). This simulation starts at t=-10d (10 days before the periastron passage) and ends at t=6.7d. The density shown in movies is in cgs units. Times are in units of the orbital period.
- The density distribution on the orbital plane (the x-y plane; the left panel) and on the plane perpendicular to the orbital plane and through the major axis (y=0; the right panel).
GIF animation (85MB); Quick Time movie (14MB)